Using Java Flight Recorder with OpenJDK 11
Java Flight Recorder (JFR) used to be a commercial add-on of the Oracle JDK. As it’s been open sourced recently along with Java Mission Control, everyone using OpenJDK 11 can now troubleshoot their Java apps with this excellent tool for free of charge. JFR, being a proprietary solution formerly, might be lesser known for those relying on previous versions of OpenJDK. Therefore, I thought it was worth writing a fresh post on using JFR with OpenJDK 11.
1. Overview
1.1. About Java Flight Recorder
JFR is profiling tool used to gather diagnostics and profiling data from a running Java application. It’s performance overhead is negligible and that’s usually below 1%. For short running apps this overhead might be above that, because JFR requires some warm-up time on the start.
Diagnosing faulty apps with JFR might shorten resolution times significantly. An anomaly can be seem from its first emergence, as it unfolds and finally until that point when it causes the application die. Of course, not all of the issues are that severe. JFR collects data about the running threads, GC cycles, locks, sockets, memory usage and about a lot more.
1.2. Java Flight Recorder went Open Source
As I mention in the intro, this one used to be a proprietary feature of the Oracle JDK and officially it was only
available for paying Oracle customers. In practice, you could enable it with the -XX:+UnlockCommercialFeatures -XX:+FlightRecorder
flags and earlier JVMs wouldn’t enforce having a license key or anything else like that.
Mark Reinhold at Oracle wanted to move Java forward faster and took inspiration from some Linux operating systems which have a release cadence of six months. I think he might have thought of Ubuntu, although he didn’t mention that namely. Nevertheless, Java SE since version 9 has got a predictable six month release cycle indeed.
To make a long story short, in order to achieve shorter release times, they’re now working on a single code base and that made Oracle JDK and OpenJDK builds interchangeable. Eventually, starting with Java 11, Oracle provides JDK releases under the open source GPL and a commercial license. If you are used to getting Oracle JDK binaries for free, download OpenJDK builds instead, they’re functionally identical identical.
As a consequence, JFR got open sourced and beyond simplifying the release process with a single code base that move renders OpenJDK more appealing to developers.
1.3. JFR packaging differences
Oracle JDK 11 emits a warning when using the -XX:+UnlockCommercialFeatures option, whereas OpenJDK doesn’t recognize
this option and reports an error.
1.4. Java Mission Control was also open sourced
JMC is a client tool used to open those production time performance and diagnostic recordings JFR produced. JMC also delivers other features, such as a JMX console and a heap dump analyzer. Oracle JDK releases from 7 to 10 contain JMC, but it has been separated and it’s now available as a separate download.
JMC has was recently open sourced as well and that means that now the whole toolset (JFR + JMC) are available to anyone using OpenJDK 11. At the time of writing, the first open source JMC version 7 hasn’t reached GA yet, but early access builds are provided.
2. Using Flight Recorder
I haven’t been using JFR in production continuously, because that would have been the violation of Oracle JDK’s license. For development everything can be used according to the best knowledge of mine. Thus folks on Oracle JDK – without having a support contract – were slated to end up with having to reproduce performance issues locally on their development machines.
Okay, then, let’s see some code. This is going to be a simple demonstration on the very basics of Java Flight Recorder and I make some trouble on purpose to give us something to debug.
public class OOMEGenerator {

  static BlockingQueue<byte[]> queue = new LinkedBlockingQueue<>();

  public static void main(String[] args) {
    new Thread(new Consumer()).start();
    new Thread(new Producer()).start();
  }

  static class Producer implements Runnable {

    public void run() {
      while (true) {
        queue.offer(new byte[3 * 1024 * 1024]);

        try {
          Thread.sleep(50);
        } catch (InterruptedException e) {
          e.printStackTrace();
        }
      }
    }

  }

  static class Consumer implements Runnable {

    public void run() {
      while (true) {
        try {
          queue.take();
          Thread.sleep(100);
        } catch (InterruptedException e) {
          e.printStackTrace();
        }
      }
    }

  }

}
For showcasing a classical OOME, we could just add new objects to a collection. I chose this one, because I see this particular pattern often in production. That is, there are two (or more) components and some of them produce new objects and some of them consume those objects. The issue stems from the fact that the capacity of that internal buffer, through which components communicate, is potentially unbounded.
When I say potentially unbounded, I mean that the buffer size multiplied by the size of an average object it is that
huge and after some time it simply eats up all the heap space. Often that takes hours, days or a week maybe, but
OutOfMemoryError will happen eventually.
Often developers think that seeing OutOfMemoryError in the logs surely reflects a programming error and a memory
leak. Sometimes heap dump analyses confirms or confutes that with certainty, but there are cases when it isn’t black or
white and you simply cannot tell. JFR with historical data comes to the resource in those cases.
2.1. Enable JFR
We can expect an OutOfMemoryError from the short program above and it takes some time, but it’s going to happen.
With JFR, we can look into the time course and characteristics of the error with full details on GC times, CPU usage and
many other things.
% java \
    -Xmx1024m \
    -Xlog:gc*=debug:file=gc.log:utctime,uptime,tid,level:filecount=10,filesize=128m \
    -XX:+HeapDumpOnOutOfMemoryError -XX:HeapDumpPath=heapdump.hprof \
    -XX:StartFlightRecording=\
        disk=true, \
        dumponexit=true, \
        filename=recording.jfr, \
        maxsize=1024m,\
        maxage=1d,\
        settings=profile \
        path-to-gc-roots=true \
    OOMEGenerator

Started recording 1.
Use jcmd 5469 JFR.dump name=1 to copy recording data to file.

Exception in thread "main" java.lang.OutOfMemoryError: Java heap space
	at nl.wizenoze.storm.OOMEGenerator.main(OOMEGenerator.java:12)

22.31s user 3.46s system 24% cpu 1:43.94 total
I’m using these debugging settings in production. In this sense these JVM arguments also serve as a note for myself, when I need them, I’ll find them here.
What’s relevant for JFR, that’s the highlighted part (lines 5-11). By default neither the maximum size of the
recording nor the maximum age or recorded data is limited. I experimented with various settings and applying both
maxage and maxsize proved to be useful. In earlier JDK versions JFR used to have more settings, but they simplified
them in version 11.
I’d like to bring your attention to the dumponexit option. Under normal circumstances, under normal the recording is
written to disk whenever capturing data is stopped. That naturally happens when JVM terminates. According to my
experiences however, when termination is abnormal, for example when heapspace run short, then the recording might be
zero bytes in size.
Although the documentation of JFR settings
isn’t very clear what difference dumponexit has, I observed that applying it is advantageous for capturing data from
troubled JVMs.
JFR comes with two factory made profiles (default and profile) and they define which events should be persisted to
captured recordings. When the settings options isn’t specified, the default profile is used. In this example, I
used the more extensive profile event definition and also enabled tracking the path to GC roots. These impose higher
overhead over the running JVM and I wouldn’t advise to use them in production.
2.2. Capturing recordings on-demand
Performance data is written to disk whenever JVM exists, however recordings can be exported on-demand at any given time
with the JCMD
utility. The JFR.check command returns details about a currently running recording.
% jcmd PID JFR.check name=1
14647:
Recording 1: name=1 maxsize=1.0GB maxage=1d (running)
Other than that, JFR.dump allows you to export whatever has been recorded so far without having to wait for a running
JVM terminate or stop a recording.
%jcmd 5469 JFR.dump name=1 filename=dump.jfrThere are other troubleshooting options the JCMD utility provides.
2.3. Analysing JFR recordings
As I mentioned before, JMC has to be downloaded separately. Although it’s an early access release only, I found it fully
usable without experiencing major glitches. In JMC 6 the Automated Analysis Results screen is added to help engineers
diagnose issues quicker. I’ve been using an older JMC 5.5 release and found this one useful and it provides useful
tips indeed. It’s correctly identified OOMEGenerator$Producer as the source or large objects being generated and it
also advises to balance allocation rate among threads.
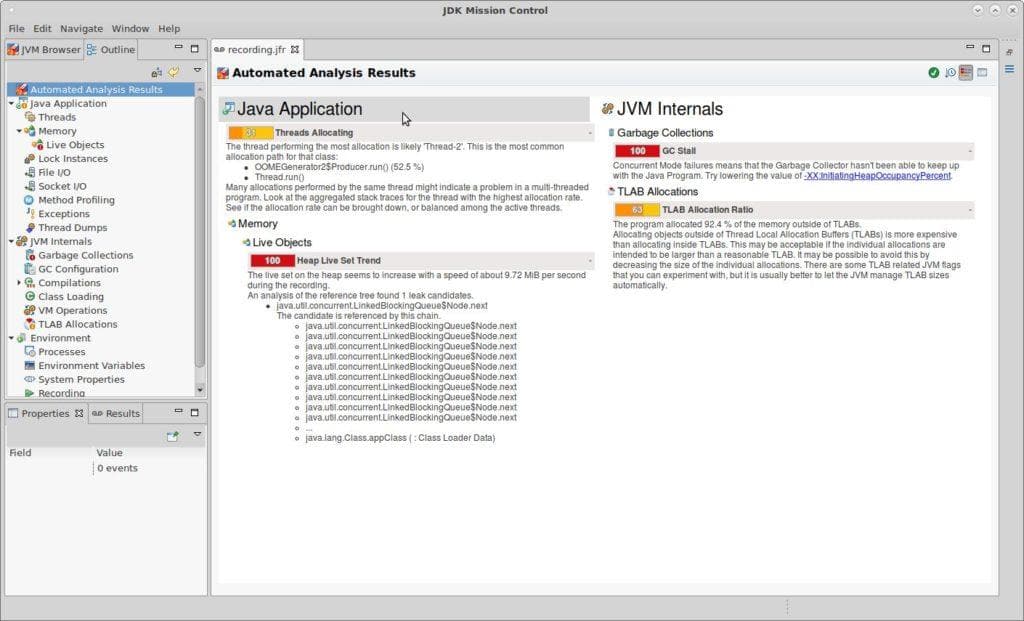 Java Mission Control 7 – Automated Analysis Results
The memory view is okay from the point of view that it provides a graph of heap usage, but for some reason numbers from the object histogram list are missing. As older releases of JMC cannot open this recording, I don’t know how this one would look like. I think this might be a bug.
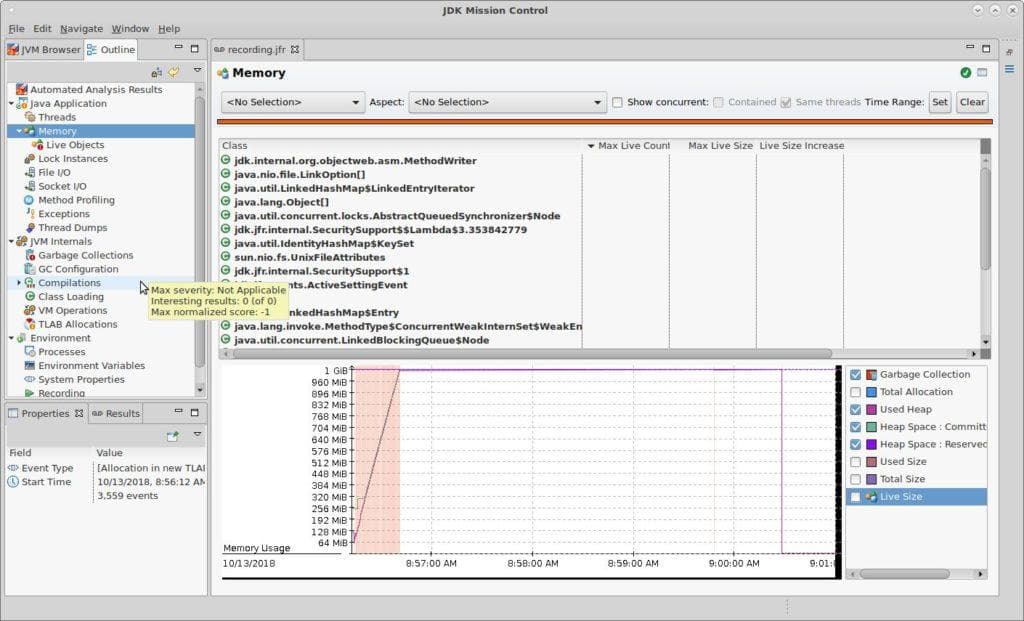 Java Mission Control 7 – Memory
Seeing the GC pause times along with heap size allocation changes is useful too, but in older JMC releases this one looked better.
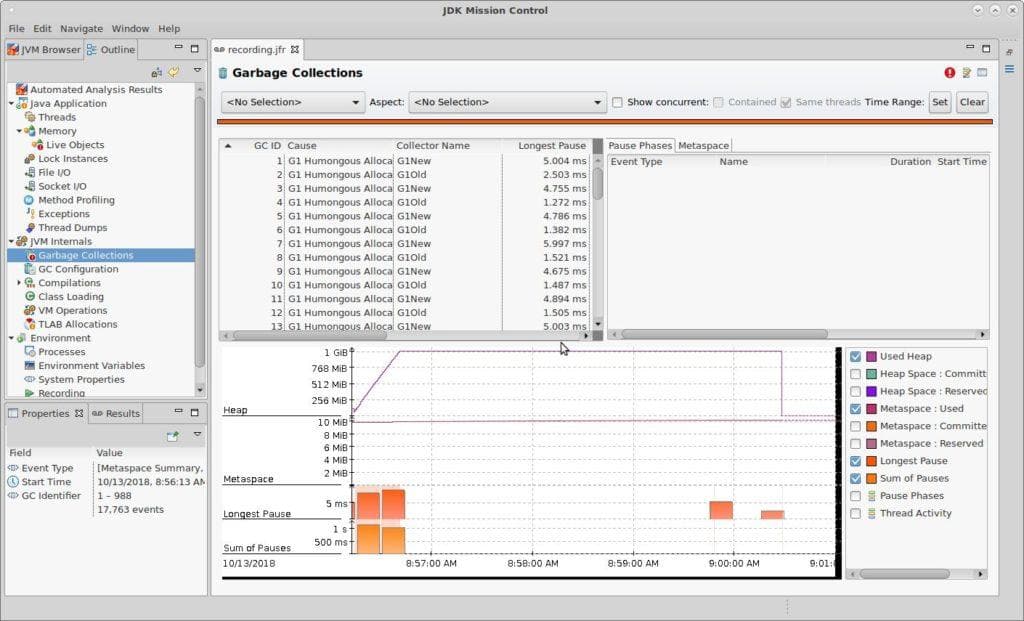 Java Mission Control 7 – Garbage Collections
3. Caveats
- JFR recordings aren’t backward compatible – recordings produced by OpenJDK 11 aren’t backward compatible and older JMC releases (tried 5.5 and 6) wouldn’t open them
- JMC 7 is still an early access release – functionality might change in GA and some bugs might be lurking here and there
- There’s a bug in the official Docker image – that prevents the JVM from starting when JFR is enabled
- JMC 7 isn’t able to analyse HPROF files – although OpenJDK’s Wiki states that it’s able a to do that
4. Conclusion
Java Flight Recorder (JFR) is profiling tool used to gather diagnostics and profiling data from a running Java application. It collects data about the running threads, GC cycles, locks, sockets, memory usage and about a lot more. JFR along with Java Mission Control, which is a tool for analyzing recording, have been open sourced and aren’t proprietary products of Oracle any longer. That move of Oracle renders OpenJDK more appealing to developers.
Java Mission Control isn’t bundled with the JDK as of version 11, but it’s available as a separate download.
With a dummy application we generated an OutOfMemoryError on purpose, captured a heap dump and a JFR recording and
analysed the latter with JMC.
JFR and JMC are new stuff in the OpenJDK’s open source space and OpenJDK 11 is also very recent at the time of writing, thus some time must pass to allow these tools to mature.
Join my Newsletter
If you like Java and Spring as much as I do, sign up for my newsletter.