JVM Observability and Tuning Best Practices

This is a collection of JVM settings I generally use in production. The article focuses on observability and G1 GC tuning.
1. Introduction
Before you would dive in and start tuning anything, consider this.
If it ain’t broke, don’t fix it (proverb)
Generally, I use the G1 garbage collector for most applications (except for Apache Storm) with its default settings. The first papers on G1 date back to 2004 and it's been available since JDk 7u4 (2012), that is, it's been around for 7 years in production.
The CMS (Concurrent Mark and Sweep) collection is now considered deprecated, as G1 is now the default GC as of JDK 9 (JEP 248)
For the majority of Java applications, where low pauses valued more than throughput, G1 is a good choice by default. For other, batching processing applications (eg. Apache Storm), the Parallel GC is still available.
2. Production Observability
For supporting JVM tuning, it's worth gathering historical data that on can analyze after an incident. Let's discuss those JVM options that I use to be able to perform an after-the-fact analysis when needed
2.1. GC Settings
For JDK 8, the G1 GC must be explicitly enabled (-XX:+UseG1GC), and for newer releases that are the default. Although the algorithm itself is very complex and sophisticated, it's easy to tune. For most applications that are just fine. More on G1 tuning comes later.
2.2. GC Logging
When things go sideways, it's helpful to be able to look into what the GC was doing and why it behaves the way it did. That sometimes hard to see just by look at metrics collected by Prometheus. Hence I use the following combination of GC logging options.
2.2.1. JDK 8
Note: on ElasticBeanstalk I found /var/cache/tomcat8/temp to be the most proper place to store GC logs and other
diagnostic files. Replace /path/to with that or another directory which matches your actual environment.
-Xloggc:/path/to/verbosegc.log
-XX:+UseGCLogFileRotation
-XX:NumberOfGCLogFiles=64 -XX:GCLogFileSize=32m
-XX:+PrintGCDetails
-XX:+PrintGCDateStamps
-XX:+PrintGCTimeStamps
-XX:+PrintGCApplicationConcurrentTime
-XX:+PrintGCApplicationStoppedTime
-XX:+PrintHeapAtGC
-XX:+PrintTenuringDistribution
-XX:+PrintReferenceGC
-XX:+PrintAdaptiveSizePolicy
2.2.2. JDK 11
Since JDK 9, unified JVM logging has been introduced (JEP 158) and the first three options must be replaced.
-Xlog:gc*=debug:file=artifacts/gc.log:utctime,uptime,tid,level:filecount=64,filesize=32mThe rest of the -XX:+Print*GC flags should be the same thought.
2.3. Automated Heap Dumping
According to my experience OutOfMemoryErrors cause confusion among developers and most of them think that the emerge
of such an error inherently indicates the presence of a memory leak.
This is not so. Nevertheless, it's best to take a heap dump automatically when that happens. The stack trace of such exceptions doesn't necessarily denote a code path where a possible leak might be.
-XX:+HeapDumpOnOutOfMemoryError -XX:HeapDumpPath=/path/to2.4. Flight Recorder
Java Flight Recorder (JFR) is just awesome and fortunately, it's been open-sourced by Oracle as of JDK 11 for JDK 8 folks need to have a subscription to use it. Although the JVM doesn't impose any restrictions, for example requiring a license key to be able to activate it.
Most of the runtime metrics can be observed with tools like Prometheus, but JFR provides insights into other details, like hot classes/methods, threads, I/O, and events.
2.4.1. JDK 8
Note: available only in Oracle JDK.
-XX:+UnlockCommercialFeatures
-XX:+FlightRecorder
-XX:FlightRecorderOptions=defaultrecording=true,disk=true,repository=/path/to,maxsize=64M,maxage=24h,maxchunksize=8M,settings=default
2.4.2. JDK 11
As of OpenJDK 11 (JEP 328), JFR is now available to everyone, as a consequence, the XX:+UnlockCommercialFeatures has gone and JFR options have also changed slightly.
-XX:StartFlightRecording=disk=true,dumponexit=true,filename=/path/to/recording.jfr,maxsize=64m,maxage=24h,settings=default2.5. Native Memory Tracking
The Native Memory Tracking (NMT) is a Java HotSpot VM feature that tracks internal memory usage for a Java HotSpot VM. As it's got 5-10% performance overhead, it's better to have it enabled only when native memory usage is being investigated.
2.5.1. Enabling NMT
To enable NMT, use the following command-line options: -XX:NativeMemoryTracking=summary
2.5.2. Accessing NMT Data using jcmd
% jcmd <pid> VM.native_memory summary3. JVM Memory Sizing
Many developers might still have the following model of the JVM heap in their minds.

The older garbage collectors (serial, parallel, CMS) structure heap into three generations (young, old, permanent).
As a result of converging HotSpot and JRockit, the permanent generation has been removed as of JDK 8.
Thus, setting the size of the permanent generation has no effect, and the JVM produces a warning that option
-XX:MaxPermSize has been deprecated. Even though some tools, eg. ElasticBeanstalk console offers such an option,
it doesn't have any effect.
A new flag is available (-XX:MaxMetaspaceSize), allowing you to limit the amount of native memory used for class
metadata. If you don’t specify this flag, the metaspace will dynamically re-size depending on the application demand at
runtime.
The G1 GC which isn't a generational collector, but heap space is divided into smaller, equal-sized areas so-called regions. A particular region might be either an eden, survivor or old region.

Other than that, the JVM also allocates memory natively with malloc outside the heap space. There's where class metadata, code cache, and GC data structures (among other things) are stored.
All that said, the most important consequence is that that setting the maximum heap space to a certain value (eg. 4096m) doesn't cover native memory areas the JVM will allocate additionally.
Let's see an example of how to set the JVM's heap size correctly, provided that we have 8196Mb of physical memory on VM.
- No more than 75-80% should be used to allow housekeeping processes, a possible a front-end webserver to operate, and also to give us a chance to use debugging tools when necessary. That's 6144Mb (75%) just for the JVM.
- Typically some data structures (eg. memory space internal to GC) scale with the heap's size and will others scale with the application's size (eg. metaspace). As a rule of thumb approximately 13-15% overhead should be calculated with, that is, we can set 5345Mb (85%) for the heap itself.
- As the metaspace might grow dynamically it makes sense to set it to a maximum value, which can be determined by using NMT.
4. G1 GC Tuning
By default, the G1 GC is easy to tune. Theoretically, you only need to set a maximum heap size and a stop-the-world pause target (250 ms is the default).
-Xmx4096m -XX:MaxGCPauseMillis=250For most applications these two parameters should be enough, there's no need to define a long list of JVM options that used to be there for the CMS collector.
4.1. Avoid Full GCs
As full GCs are single-threaded and slow, we want to avoid them at all costs. The -XX:+PrintAdaptiveSizePolicy JVM
option can be enabled to track them.
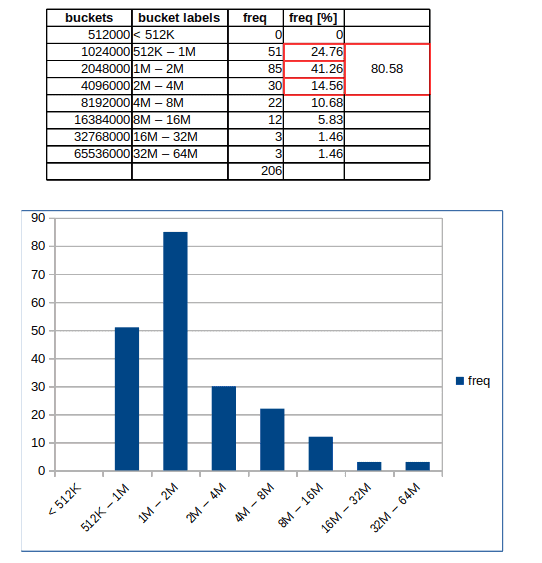
4.2. Avoid Humongous Allocations
If G1 GC has an Achilles-heel that is humongous objects. Humongous allocations are allocations that are larger than 50% of the region size in G1. As those are treated specially by G1, they can be considered as an exception to normal allocations. Thus when garbage is collected by G1 humongous objects impose an overhead in getting rid of them.
In the case of an 8192Mb large heap, G1 divides the heap into 2048 4Mb regions. When an allocation request is larger than half of that, that is, it's >2Mb then a humongous allocation is made.
The -XX:+PrintAdaptiveSizePolicy flag help spotting these allocations.
After processing the GC logs, they can be depicted on a histogram bucketed by allocation size.
There are three ways to get rid of them:
- Check of they're legitimate? Isn't this a programming of a software design error that leads to the allocation of large chunks of memory?
- Increase max heap size
- Increase region size with
-XX:G1HeapRegionSize
5. Conclusion
- Setup GC logging and automated heap dumping to support after-the-fact analyses of incidents
- Be aware that permanent generation doesn't exist anymore, class metadata is stored in native memory. You can inspect that as well, which comes at a 5-10% overhead
- G1 GC usually works well with defaults. If there is a problem mostly humongous allocations cause it.
Join my Newsletter
If you like Java and Spring as much as I do, sign up for my newsletter.